
Comparing Air Quality Targets Around the World – Part 5: Temperature & Relative Humidity
Table of Contents
Temperature and relative humidity are among the most familiar measures in building operation. They are visible on thermostats, building-management systems, and indoor environmental dashboards. They are also widely used in building standards to define acceptable indoor conditions.
But a temperature or humidity reading is not, by itself, a measure of thermal comfort. Two offices can both be maintained at 24°C and 50% relative humidity, yet feel noticeably different to their occupants. Air movement, radiant heat from surrounding surfaces, clothing, and activity all affect how a space feels.
This bonus fifth article in the Air Quality Target Comparison Series begins with the familiar metrics: temperature and relative humidity. It then considers what fixed ranges can and cannot tell us, how predictive thermal-comfort models account for the wider set of variables, and how continuous monitoring helps verify whether intended conditions persist in operation.
About This Series
This article is a bonus Part 5 in the Air Quality Target Comparison Series.
Part 1 — Particulate Matter: PM2.5 and PM10
Part 2 — Carbon Gases: CO2 and CO
Part 3 — Organic Chemicals: TVOC and formaldehyde
Part 4 — Inorganic Gases and Radon: Ozone, nitrogen dioxide, sulfur dioxide, and radon
(Bonus) Part 5 — Thermal Comfort: Temperature and relative humidity
Standards referenced in this series (16 total): WHO 2021, EPA NAAQS, EU Directive 2024/2881, Singapore SS 554 (2021), China GB/T 18883, RESET Air v2.0, LEED v5 O+M, WELL v2, Fitwel, Living Building Challenge (LBC), ASHRAE 62.1 (2022), DGNB, BOMA BEST, Singapore Green Mark, HKGBC BEAM Plus, and China Green Building Standard.
How to Read This Comparison
Temperature and relative humidity differ from pollutant concentrations. They are environmental conditions that contribute to thermal comfort, rather than contaminants with a single concentration-based exposure target.
The ranges in the charts and tables below show how frameworks communicate temperature and humidity expectations and are useful reference points.
Frameworks account for different seasons, climates, building types, and operating conditions. Their targets may therefore serve different purposes and should be interpreted within their stated context.
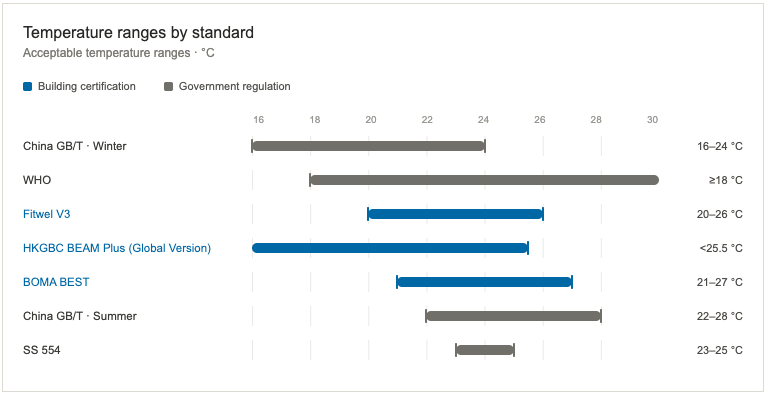
Temperature Comparison
Comparison Table
| Standard | Minimum | Maximum | Type |
|---|---|---|---|
| China GB/T — Winter | 16°C | 24°C | Government |
| WHO | 18°C | — | Government guideline |
| Fitwel v3 | 20°C | 26°C | Certification |
| HKGBC BEAM Plus (Global Version) | — | 25.5°C | Certification |
| BOMA BEST | 21°C | 27°C | Certification |
| China GB/T — Summer | 22°C | 28°C | Government |
| SS 554 | 23°C | 25°C | Government |
What the Results Mean
The comparison spans 16°C to 28°C and represents a wide range of considerations. Within the certification ranges shown, there is substantial overlap around the low-to-mid twenties.
China GB/T distinguishes winter and summer conditions, allowing for more extreme temperatures such as 16°C in the winter and 28°C in the summer due to considerations of energy conservation and peak power demand, along with adaptive thermal comfort, where field research studies have shown that occupants in hot and humid climate zones in China develop a high physiological and psychological tolerance to warmer indoor temperatures when local air movement, leveraging ceiling or desk fans, and lighter clothing are utilized.
WHO’s 18°C value is a health-protective minimum for cold-season housing in temperate and colder climates, rather than a complete thermal-comfort band.
The above temperature targets are a useful operational reference, but the additional consideration of local air movement and clothing choice as mentioned in adaptive thermal comfort, along with the amount of sunlight shining in through windows, might also impact thermal comfort. For example, a space at 24°C may feel warm, neutral, or cool depending on radiation from windows and surfaces, air speed, clothing, and activity.
Key insight: The standards converge around 20°C to 26°C, while their outer limits vary with season, climate, and purpose.
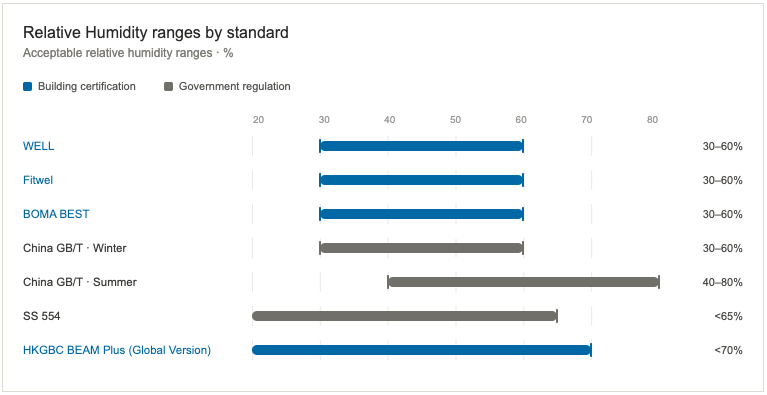
Relative Humidity Comparison
Comparison Table
| Standard | Minimum | Maximum | Type |
|---|---|---|---|
| WELL | 30% | 60% | Certification |
| Fitwel | 30% | 60% | Certification |
| BOMA BEST | 30% | 60% | Certification |
| China GB/T — Winter | 30% | 60% | Government |
| China GB/T — Summer | 40% | 80% | Government |
| SS 554 | — | 65% | Government |
| HKGBC BEAM Plus (Global Version) | — | 70% | Certification |
What the Results Mean
The 30–60% range recurs across several frameworks. This range reflects both comfort and health considerations: the U.S. Environmental Protection Agency recommends keeping indoor relative humidity below 60%, ideally between 30% and 50%, to help prevent mold growth, while very dry air can contribute to dry eyes, skin, and mucous membranes.
In warmer or more humid climates, some frameworks allow higher upper limits. China GB/T’s summer range reaches 80%, again, for energy considerations, while Singapore's SS 554 and Hong Kong's HKGBC BEAM Plus provide only upper limits rather than complete bands, reflecting the practical challenge of controlling high outdoor moisture in warm, humid climates. In drier regions, the opposite concern can be more important, which is why some frameworks also specify a minimum relative humidity.
For comfort, high relative humidity has its strongest direct effect at warmer temperatures, where it can make it harder for the body to cool itself through evaporation. In colder conditions, humidity has less direct effect, but a space can still feel clammy and cold when walls, windows, or floors are cold and provide less radiant warmth. High humidity can also increase the likelihood of condensation on these cold surfaces, while drafts or damp clothing can further increase heat loss. In the same vein as temperature, relative humidity is only part of the thermal comfort equation and can feel different when temperature, air speed, radiant conditions, clothing, or activity change.
For health, persistent high humidity can contribute to condensation and mold growth when surfaces remain damp. It can also support dust mites and other moisture-related indoor pollutants. At the other extreme, very low relative humidity can dry the eyes, skin, nose, and throat. Humidity may also influence how long some airborne viruses remain infectious, but the effect varies by virus and is shaped by temperature and other conditions.
Key insight: Four frameworks specify the 30–60% relative humidity. The range is widely used because it balances the need to avoid very dry indoor conditions with the need to limit moisture, condensation, and mold risk. Very dry air can contribute to dry eyes, skin, nose, and throat, while high humidity can make warm spaces feel more uncomfortable by limiting evaporative cooling, in addition to supporting condensation and mold growth.
Beyond Temperature and Relative Humidity
In both the temperature and relative humidity results explanation, it was mentioned that neither temperature nor relative humidity by itself provides a complete picture for thermal comfort.
For example, two offices can both report 24°C and 50% relative humidity and still produce different comfort outcomes. In one office, still air, typical workwear, and neutral surrounding surfaces may support a neutral experience. In another, direct afternoon sun at a west-facing window or heavier clothing can make occupants feel warm, even though the thermostat has not changed.
Temperature and humidity are measurements. Thermal comfort is an outcome.
The fixed ranges for temperature and relative humidity remain useful because they help set operating expectations and can help establish systems to detect obvious deviations and support day-to-day facilities management, but they cannot describe the full thermal environment on their own.
Thermal comfort standards evaluate environmental and personal factors together, rather than relying on temperature or humidity alone. For example, ANSI/ASHRAE Standard 55 uses PMV and PPD as part of its standard method for assessing thermal comfort. Predicted Mean Vote (PMV) estimates how a group of occupants is likely to experience the thermal environment, while Predicted Percentage Dissatisfied (PPD) estimates how many may find those conditions unacceptable.
In addition to temperature and relative humidity, PMV and PPD consider air speed, radiant heat from surrounding surfaces, what people are doing, and what they are wearing, which are all factors affecting thermal comfort. Including them as parameters allows them to be considered in design.
From Design Intent to Operational Performance
ANSI/ASHRAE Standard 55 was first published in 1966, so we've been using predictive models for thermal comfort for 60 years. Predictive models are great for design intent and establishing expected or target conditions. How do we track operational performance? This is where continuous monitoring comes in.
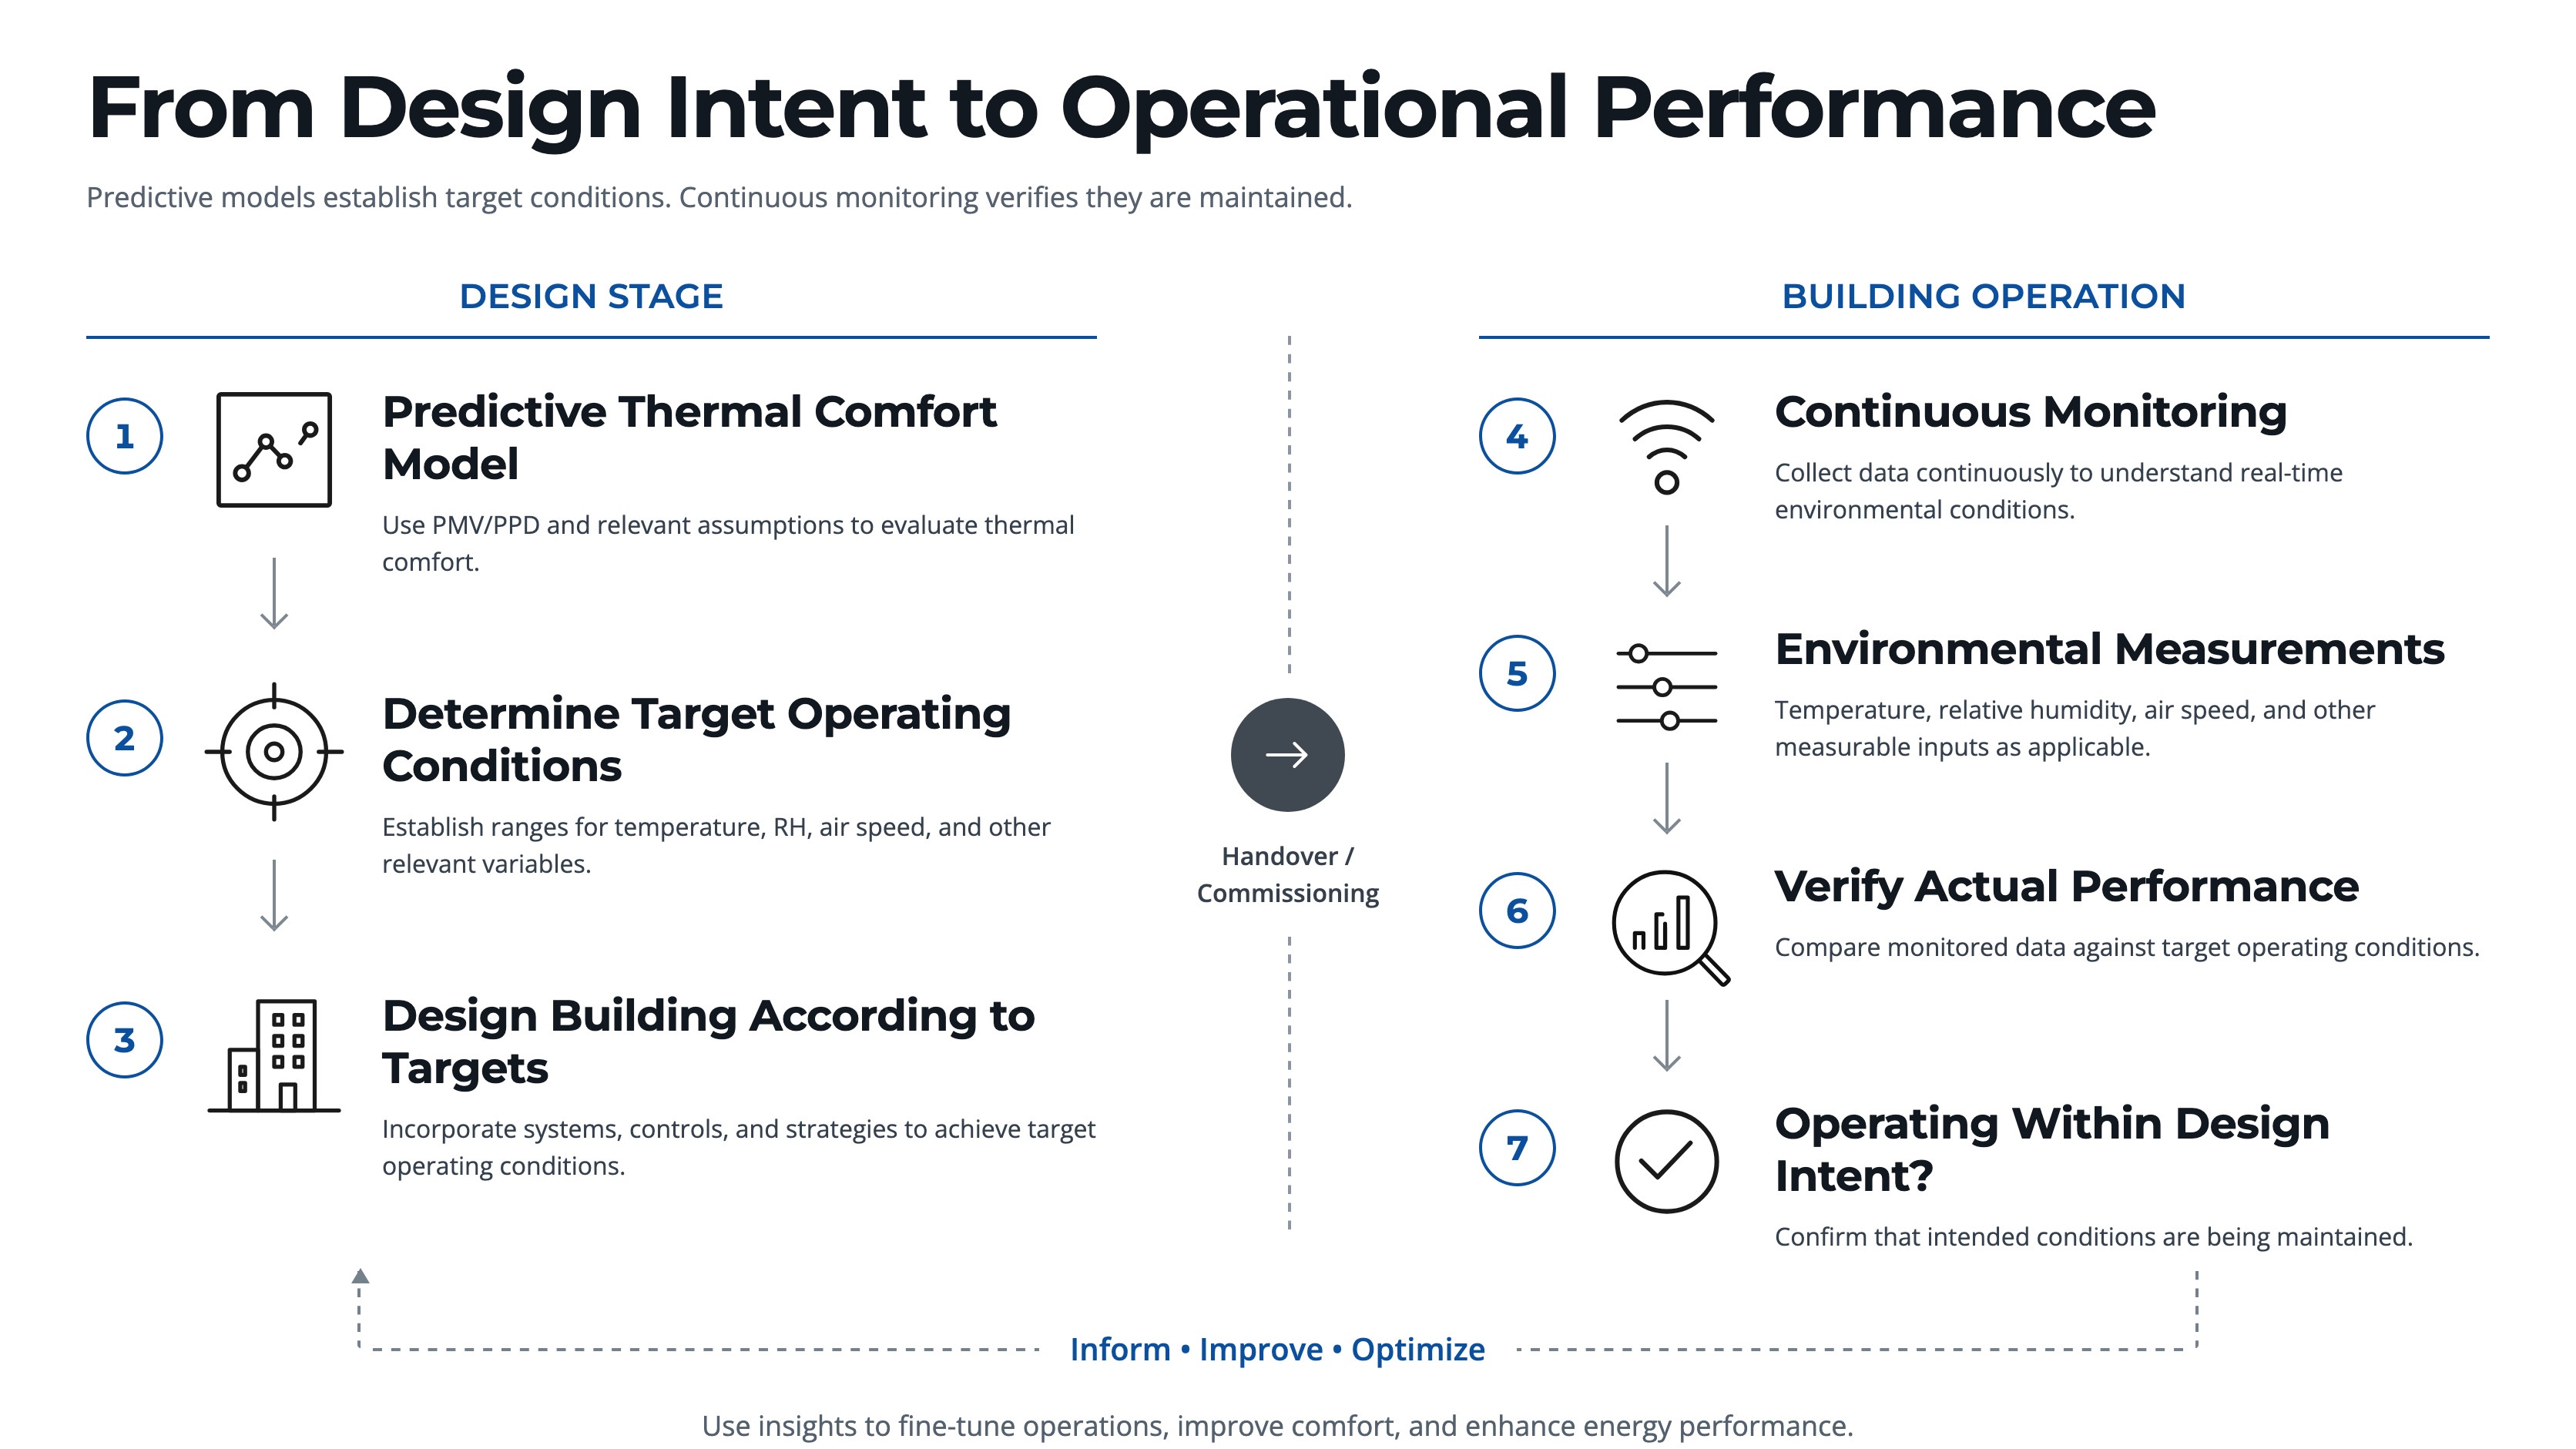
Design stage

Predictive thermal-comfort model
        ↓
Determine target operating conditions
        ↓
Design building according to targets
────────────────────────────────────

Building operation

Continuous monitoring
        ↓
Temperature / RH / air speed / other measurable inputs
        ↓
Verify actual performance
        ↓
Are intended conditions being maintained?
Thermal-comfort modelling and continuous performance verification are complementary with different focus. The model is used to design the building. Continuous monitoring verifies actual performance, providing the input to adjust accordingly.
This distinction is relevant to the RESET Standard’s performance-oriented approach. Continuous monitoring is not a replacement for thermal-comfort modelling, but rather, it can complement it by making ongoing temperature, relative humidity, and other available environmental data visible to operators and occupants.
There are limitations to continuous monitoring though, since not everything can be monitored cost efficiently.
| Variable | Continuous-monitoring accessibility |
|---|---|
| Air temperature | Widely available and generally inexpensive |
| Relative humidity | Widely available and generally inexpensive |
| Air speed | Available with dedicated sensors, but more specialized and placement-sensitive |
| Mean radiant temperature | Available with specialized radiant or globe sensors; less common in routine monitoring |
| Clothing insulation (CLO) | Not directly measurable by building sensors; usually assumed or estimated |
| Metabolic rate (MET) | Not directly measurable by building sensors; usually assumed from activity or occupancy type |
Air speed and mean radiant temperature can be monitored, but they require more specialized instruments and are less common in long-term continuous monitoring. Point-in-time testing is therefore often used to support thermal comfort calculations.
Interpreting Continuous Data
Even where continuous measurement is practical, the data still needs context. Sensor location affects whether a reading represents what occupants experience, and humidity trends require interpretation before they can indicate a moisture concern.
A thermostat or temperature sensor placed at different heights, or near a diffuser, window, ceiling, floor, or outside the occupied area may misrepresent occupant conditions because temperature is not uniform across an indoor space. If that sensor also controls the HVAC system, its location can affect how much heating or cooling the space receives.
Continuous relative humidity data can help identify periods when a space is persistently humid, which may warrant investigation for moisture problems. The data cannot confirm mold on its own because mold risk also depends on other factors such as leaks, condensation, surface temperature, moisture held within building materials, ventilation, etc. Combined with maintenance records and other building data, the trends from the continuous monitoring data can help facilities teams prioritize inspections.
Conclusion: From Fixed Ranges to Verified Performance
Temperature and relative humidity remain the most useful and practical operational metrics, and are the most widely accessible metrics for long-term continuous monitoring. The comparison shows meaningful overlap between several standards and frameworks for projects and teams to use for reference.
For thermal comfort, fixed ranges for temperature and relative humidity cannot fully define comfort across seasons, climates, buildings, and occupants, which is where predictive models come in to add the missing context. The interaction of temperature, humidity, air speed, radiant conditions, clothing, and activity all contribute to thermal comfort. Implementing long-term continuous monitoring can add an additional layer of verification of whether measurable environmental conditions are actually maintained in operation.
The progression is therefore not from one approach to another, but from fixed operating ranges, to predictive design, to continuous operational verification. Predictive models describe what should happen. Continuous monitoring shows what is happening.
Appendix: Source and Publication Checks
World Health Organization. Housing and health guidelines. WHO describes 18°C as a proposed safe and well-balanced minimum indoor temperature for the cold season in temperate or colder climates; it is not a full thermal-comfort range.
U.S. Environmental Protection Agency. Mold House Tour. EPA recommends keeping indoor relative humidity below 60%, ideally between 30% and 50%, to help prevent mold growth.
Singapore SS 554 (2021) : SS 554:2016+A1:2021 Code of Practice for Indoor Air Quality for Air-Conditioned Buildings. p. 20.
China GB/T 18883-2022: GB/T 18883-2022 室内空气质量标准. p. 3.
ASHRAE. Standard 55 — Thermal Environmental Conditions for Human Occupancy. The standard addresses temperature, thermal radiation, humidity, air speed, activity, and clothing together.
ASHRAE. Addendum h to Standard 55-2020. The guidance specifies measurement locations and different heights above the floor for seated and standing occupants.
International WELL Building Institute. Thermal comfort evidence for humidity control. WELL describes a 30–60% relative-humidity pathway and the multiple contributors to thermal comfort.
Fitwel: Fitwel v3 Indoor Air Quality Assessment Protocol. p. 13.
BOMA BEST: BOMA BEST Field Guide.
HK BEAM PLUS: Existing Buildings Global Version. p. 160.
